Welcome to Jamani’s comprehensive Blog. Here, we will delve into the vital metrics that drive online success. “Learn the Top Matrices of SEO will uncover the key performance indicators (KPIs) that illuminate the effectiveness of your digital strategies. From organic search traffic and keyword rankings to conversion rates and backlink quality, we’ll navigate through the essential data points that empower your website’s visibility and growth. Whether you’re a business owner, marketer, or simply curious about enhancing your online presence, this exploration will empower you to harness the power of SEO Services in Chandigarh’s competitive landscape.
Organic search traffic
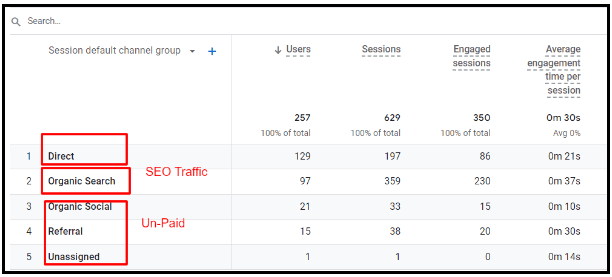
The “Organic search traffic” is crucial for assessing a website’s online visibility and performance. It represents the number of visitors who arrive at a site through “Unpaid,” “Direct Traffic,” or “SEO Traffic.” This traffic is driven by search engine optimization (SEO) efforts, ensuring that a website ranks high on relevant search queries. Organic search traffic is valuable because it brings in qualified leads and potential customers as users actively seek information or solutions. By monitoring this metric with the help of SEO Services in Chandigarh, businesses can gauge their website’s overall health and the effectiveness of their strategies and identify areas for improvement to increase organic reach and engagement.

2) Keyword rankings
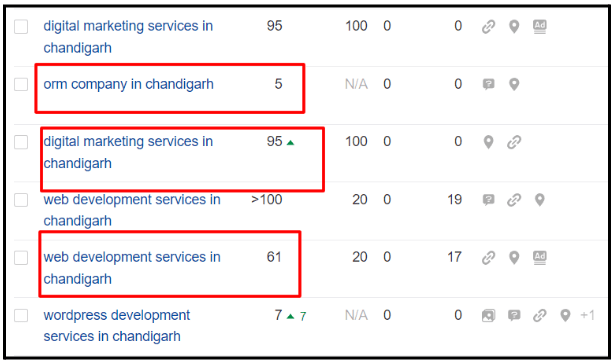
Keyword ranking refers to a website’s position in search engine results pages (SERPs) for specific search terms, influencing its visibility and attracting organic traffic. And the Keyword matrix monitors and assess keywords’ performance in search engine results. The matrix typically displays keywords, their corresponding rankings, and relevant metrics such as search volume and competition level. Analyzing this data allows businesses to identify top-performing keywords, optimize content, and improve overall search visibility. Regularly tracking the matrix aids in making informed decisions and staying ahead of competitors in the dynamic world of online search.

3) Click-Through Rate Metric
Click-Through Rate (CTR) is considered an essential metric for online advertising and marketing campaigns. It measures the percentage of users who click on a specific link, ad, or call-to-action after viewing it. A high CTR indicates strong user engagement and relevance of the content, leading to better ad performance and potential conversions. CTR is used to evaluate the effectiveness of campaigns, optimize content, and improve overall user experience. Monitoring and enhancing CTR can significantly impact the success of online marketing efforts. If you want to check your CTR, follow the metric mentioned here.
To calculate the Click-Through Rate (CTR), follow these steps
Gather data
Access your advertising or analytics platform, such as Google Ads or Google Analytics, to obtain the necessary data.
Determine impressions
Find the total number of impressions for your ad or link. Impressions represent the number of times your ad or link was shown to users.
Find clicks
Identify the total number of clicks your ad or link received. Clicks represent the number of times users clicked on your ad or link.
Calculate CTR
Divide the number of clicks by the number of impressions and multiply the result by 100 to get the CTR as a percentage.
CTR (%) = (Clicks / Impressions) * 100
For example, if your ad received 1000 impressions and 50 clicks, the CTR would be:
CTR = (50 / 1000) * 100 = 5%
This means your ad achieved a 5% Click-Through Rate, indicating that 5% of the people who saw your ad clicked on it. CTR is a crucial metric in online advertising as it helps assess the ad’s effectiveness and relevance to the target audience.
4) Organic Conversion Rate
Organic Conversion Rate helps to measure the percentage of website visitors who perform a desired action, like making a purchase or filling out a contact form, through organic search results. Targeted keyword research, content relevancy, and user experience are significant terms to help optimize the Organic Conversion Rate. Local SEO strategies can enhance organic traffic and boost conversion rates, leading to greater online visibility and business success in the region.
To calculate the Organic Conversion Rate, follow these steps
1. Determine Your Conversion Actions
Identify the specific actions you consider as “conversions” on your website. These could be purchasing, signing up for a newsletter, filling out a contact form, etc.
2. Gather Data
Use your website analytics tool (such as Google Analytics) to gather data on the number of organic visitors and the number of organic conversions within a specific time frame.
3. Calculate the Organic Conversion Rate
Organic Conversion Rate = (Number of Organic Conversions / Number of Organic Visitors) x 100
4. Interpret the Result
The resulting percentage is your Organic Conversion Rate. This metric indicates the effectiveness of your organic traffic in generating desired actions on your website.
For example, if you had 500 organic visitors in a month and 30 of them completed a conversion action, your Organic Conversion Rate would be:
Organic Conversion Rate = (30 / 500) x 100 = 6%
A higher Organic Conversion Rate suggests that your organic traffic is more engaged and likely to convert, while a lower rate may indicate areas for optimization in your website’s user experience or conversion funnel.
5) Bounce Rate Metric
Bounce rate is a website metric that measures the percentage of visitors who navigate away from a webpage after viewing only that page. A high bounce rate can indicate a lack of engagement or relevance, prompting a need for improved content or user experience. To improve this metric, optimize website content, enhance the user interface, and ensure the landing page aligns precisely with the search intent, leading to better conversions and higher rankings in search results.
To calculate the bounce rate, you need two pieces of data: the number of single-page visits (bounces) and the total number of visits to your website or a specific page. The formula for calculating the bounce rate is as follows
Bounce Rate = (Total Number of Bounces / Total Number of Visits) * 100
Let’s break it down with an example:
Suppose you have a website offering SEO services in Chandigarh, and you track the following data for a specific page:
Total Number of Visits to the page: 1000 Number of Single-Page Visits (Bounces): 300
To calculate the bounce rate for this page:
Bounce Rate = (300 / 1000) * 100 Bounce Rate = 0.3 * 100 Bounce Rate = 30%
This means that 30% of visitors left the page after viewing only one page without further interaction or exploration. A lower bounce rate indicates better engagement and user experience.
6) Average Session Duration
Pages per Session matric indicates the average number of pages a user views during a website visit. This metric reflects user engagement and the website’s ability to retain visitors, directly impacting SEO rankings. Businesses can increase pages per Session by optimizing user experience and content relevancy, indicating satisfied and interested users. To achieve this, focus on creating valuable, engaging, and locally relevant content, improve site navigation, and implement internal linking strategies. A higher page-per-session metric enhances SEO rankings and boosts the chances of converting visitors into loyal customers.
Calculating Pages Per Session is a simple process that involves dividing the total number of pages viewed during a given period by the total number of sessions or visits within that same period. Here’s the formula:
Pages Per Session = Total Number of Pages Viewed / Total Number of Sessions
To calculate it for a specific period, follow these steps:
- Access your website’s analytics tool (such as Google Analytics).
- Set the desired date range for the analysis.
- Find the total number of pages viewed during that period (usually available in the “Pageviews” metric).
- Find the total number of sessions or visits during the same period (usually available in the “Sessions” or “Visits” metric).
- Divide the total number of pages viewed by the total number of sessions to get the Pages Per Session metric.
For instance, if you had 5000 pageviews and 1000 sessions in a specific month:
Pages Per Session = 5000 (pageviews) / 1000 (sessions) = 5
The average number of pages viewed per Session is 5.
When it comes to SEO services in Chandigarh, one crucial metric that businesses should monitor is the Average Session Duration. This metric measures the average time users spend on a website during a single session. A longer average session duration indicates that visitors are engaging with the content, finding it relevant, and possibly converting into potential customers. Businesses can extend the average session duration by optimizing SEO strategies, such as providing valuable and engaging content, optimizing user experience, and incorporating relevant keywords. The strategy positively impacts search engine rankings, increases website visibility, and enhances the chances of attracting qualified leads and achieving business goals.
To calculate the Average Session Duration metric, follow these steps
1. Gather data
Access your website’s analytics tool, such as Google Analytics, and look for the “Sessions” data for a specific time period.
2. Get total session duration
The analytics tool records the time the user spends on the website for each session. Add up the duration of all sessions during the selected period.
3. Count sessions
Determine the total number of sessions that occurred during the same time period.
4. Calculate the average
Divide the total session duration (from Step 2) by the number of sessions (from Step 3) to get the average session duration.
Average Session Duration = Total Session Duration / Number of Sessions
The result will be displayed in a time format, such as HH:MM: SS (hours:minutes: seconds) or decimal form, representing the average time users spent on your website during a single session.
Final Words
Understanding and Learn these top matrices of SEO is paramount to achieving an effective SEO strategy. By analyzing organic traffic, conversion rate, bounce rate, keyword rankings, average session duration, and backlinks, businesses can identify areas for improvement and refine their SEO strategies accordingly. Partnering with a reputable provider of SEO service in Chandigarh will enable you to leverage these metrics effectively, boost your online visibility, attract targeted traffic, and ultimately achieve online success in the competitive digital landscape. Stay informed, adapt to changing trends, and embrace data-driven decision-making to excel in the world of SEO.


0 Comments